Nasdaq Composite (^IXIC) chart
Nasdaq Composite closed at 27,193.34 on October 8, 2026 (Nasdaq GIDS). The chart below shows every daily close over the past year. Open it in the editor to restyle it and download a PNG or PDF sized for PowerPoint, Keynote, or Google Slides.
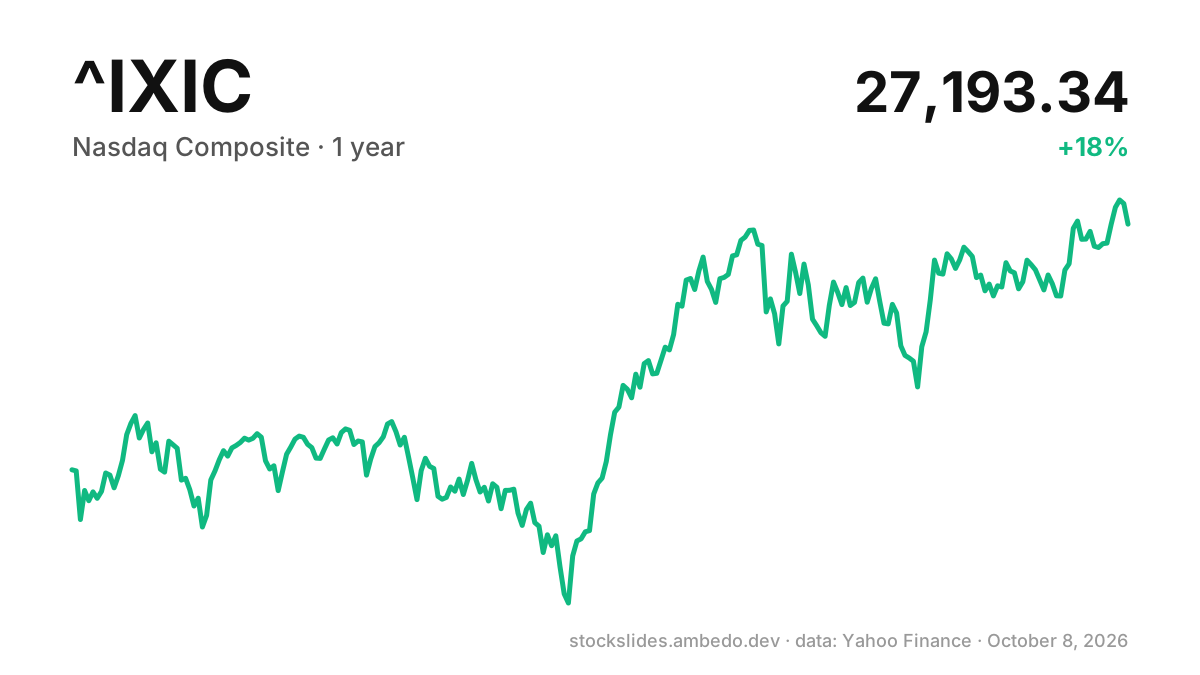
^IXIC price change
| Period | Change |
|---|---|
| 1 month | +2.9% |
| 6 months | +19.2% |
| Year to date | +16.1% |
| 1 year | +18% |
| 5 years | +86.5% |
| 52-week high close | 27,599.79 |
| 52-week low close | 20,794.64 |
| Largest drop from a high, past year | -13.2% |
Based on daily closing prices from Yahoo Finance, adjusted for splits, not for dividends. Prices are delayed and refresh about once an hour. Not investment advice.
Other time ranges
1D · 1W · 1M · 6M · 1Y · 5Y · MAX
Put this chart in a presentation
- Open the ^IXIC chart in the editor.
- Pick a layout and a time range from 1 day to all time.
- Export at 1080p, 4K, square, or story size as a PNG, or as a PDF.
- Drag the file onto your slide. See the guide for PowerPoint, Google Slides, and Keynote.