Home Depot (HD) stock chart
Home Depot closed at $295.47 on October 8, 2026 (NYSE). The chart below shows every daily close over the past year. Open it in the editor to restyle it and download a PNG or PDF sized for PowerPoint, Keynote, or Google Slides.
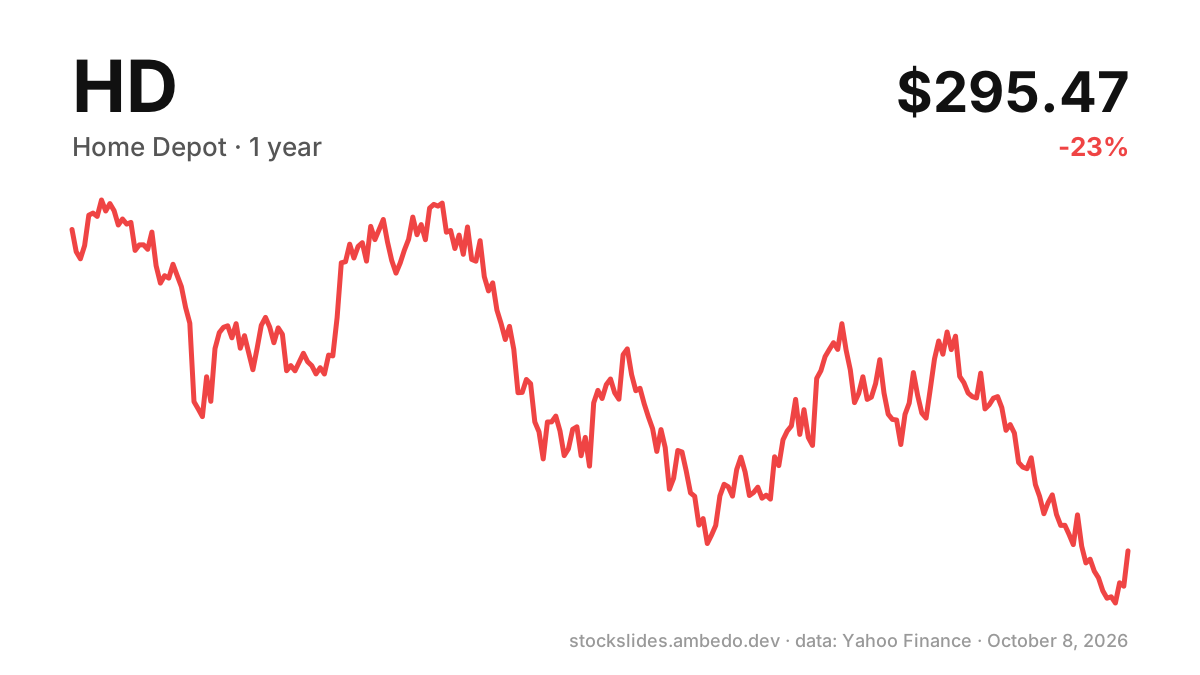
HD price change
| Period | Change |
|---|---|
| 1 month | -5.8% |
| 6 months | -13% |
| Year to date | -14.7% |
| 1 year | -23% |
| 5 years | -11.6% |
| 52-week high close | $391.90 |
| 52-week low close | $281.15 |
| Largest drop from a high, past year | -28.3% |
Based on daily closing prices from Yahoo Finance, adjusted for splits, not for dividends. Prices are delayed and refresh about once an hour. Not investment advice.
Other time ranges
1D · 1W · 1M · 6M · 1Y · 5Y · MAX
Put this chart in a presentation
- Open the HD chart in the editor.
- Pick a layout and a time range from 1 day to all time.
- Export at 1080p, 4K, square, or story size as a PNG, or as a PDF.
- Drag the file onto your slide. See the guide for PowerPoint, Google Slides, and Keynote.